The Need for a Levels Framework
Every operating company eventually has some kind of reporting cadence, even if it is only the basic accounting required to file taxes and pay vendors. What most companies actually want is something more useful than that floor. They want enough visibility into the business to know what their baseline looks like, to spot which direction it is moving, and to test whether the initiatives they fund (value-creation plans, growth bets, operational changes, acquisitions) are actually doing anything to it.
The problem itself is roughly as old as the public corporation. The modern, data-driven version of it is roughly as old as the personal computer.
What has changed, in the four decades since spreadsheets first arrived on desktop PC’s, is the cost and capability of the substrate underneath the reporting. The cloud-computing revolution removed the requirement to own the hardware: an analyst with a credit card can now stand up infrastructure that would once have required a server room and a small team of database administrators.
On top of the cloud, three layers in particular reshaped what operators could see and do.
Databases came first. A database stores structured records (customers, orders, transactions, employees) and is optimized for the transactional workloads that actually run the business: writing a row when an invoice is issued, updating a status when an order ships, marking a ticket closed. Production systems run on databases. They are not designed to be queried for insight at scale, and asking them to do so tends to slow them down for the people trying to do their jobs.
Data warehouses (Snowflake, BigQuery, Amazon Redshift) solved that. A warehouse is a separate analytical store, optimized for slicing large structured datasets fast: pulling every transaction in a region over a quarter, joining it against the customer table, and aggregating the result without touching the production system. The modern reporting layer that most operators are now used to (the dashboards, the board packs, the cross-portfolio comparisons) runs on a warehouse, not on the underlying production database.
Data lakes extended the model again by lowering the cost of storing data whose shape is not known in advance: log files, document repositories, sensor streams, contract text, call transcripts. A lake holds everything cheaply, structured or not, and lets analysts and machine-learning systems pull from it as needed. In practice, modern stacks blend the warehouse and lake patterns; the distinction matters less than the fact that storing and querying business data is now an order of magnitude cheaper and faster than it was even a decade ago.
As that substrate matured, statistics and machine learning began to compound the advantage. Companies with a working data foundation could model churn, forecast demand, segment customers, score credit, and optimize logistics in ways that companies without one could not, regardless of how strong their analysts were. The gap widened not because the math got harder, but because the foundation was the precondition the math depended on.
Over the last four years, the AI revolution has promised to change every aspect of work. The promise is real. The execution, in most operating companies, is not. Companies are spending heavily on AI deployments with no measurable return, and the cause is almost never the AI itself. It is that intelligence layers are being bolted on top of operations that never built the underlying reporting, analytics, and data discipline.
AI on top of incoherent data behaves the way every previous layer on top of incoherent data has behaved: it produces confident, well-formatted outputs that nobody can verify and nobody trusts. The companies that quietly built the foundation in the warehouse era are now compounding the advantage. The companies that did not are paying for the privilege of trying to looking “AI-first.”
Compounding the problem, most operators have no working framework to diagnose where they actually sit on this arc. They cannot reliably separate reporting from analytics, analytics from AI, or a foundation problem from a tooling problem. When they guess, the instinct is to guess high: the portfolio already has dashboards, the reporting is basically automated, the data is pretty far along. But, the monthly board pack still takes three days to assemble, the CFO and the COO arrive at the same meeting with different numbers for the same metric, and the dashboard everyone points to is quietly rebuilt by hand every cycle by an analyst who never takes a vacation.
The result is a capital-allocation problem rather than a competence problem: capable operators commission AI deployments before they have the substrate that would make AI worth deploying, and spend months of budget solving the wrong problem.
The Aptum AI Levels are a framework built to solve that problem.
They name five business states along the data and AI maturity arc, from manual reporting with no data foundation to human-in-the-loop autonomous operation. Each state is described in business operator language rather than engineering language. Each is self-diagnosable in fifteen minutes. The whole ladder fits on a single page.
The Levels are an adaptation of a maturity framework developed inside Palantir to guide their deployments at some of the world's largest enterprises, sharpened during Aptum AI's founder's selection to the inaugural cohort of Palantir's American Tech Fellowship for Veterans.
The original is written in engineering language for an audience of software developers and forward deployed engineers inside some of the most demanding data environments in the world. Aptum AI has translated it into the operating reality of PE-backed sub-institutional companies, where the buyer is an operating partner or a portfolio CEO, the existing data foundation is usually closer to a stack of spreadsheets than to a Palantir Foundry deployment, and the value-creation horizon is measured in quarters rather than years.
The structural lineage is acknowledged; the operator translation, and the engagement architecture mapped to it, are Aptum AI's own.
What the Levels measure
Navigation by dead reckoning works by plotting each move forward from a known position. The method is reliable only as long as your azimuth and pace count are accurate. But equally important is knowing your starting point on the map. Misjudge you’re starting position and every subsequent step is in error, compounding with distance. The first discipline of navigation is not choosing a heading. It is fixing your position accurately.
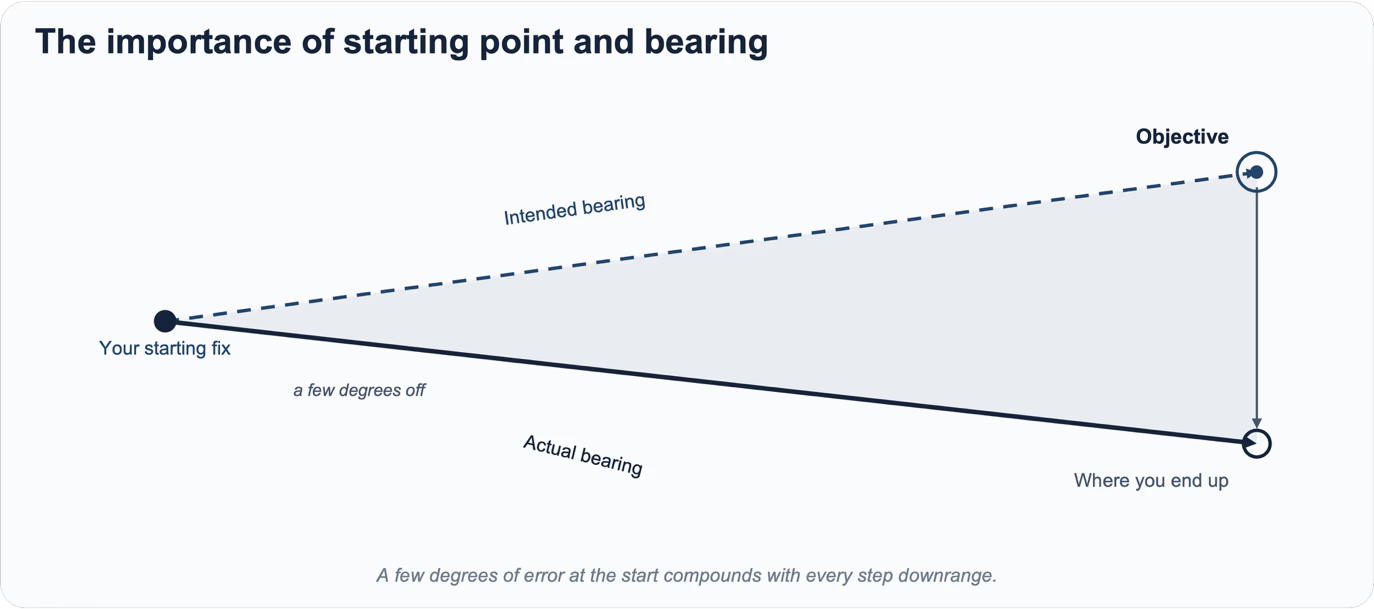
The cost of a wrong fix: a small error in your starting position widens with every step downrange.
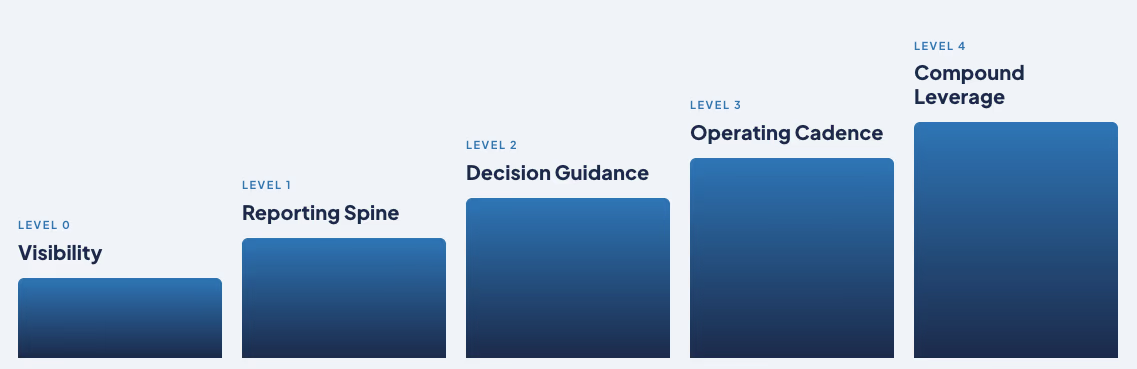
The Aptum Levels are that fix. Before an operator can decide what to build next, what to buy, or what to fund, they need an accurate read on where the business actually sits. The framework names five positions, each carrying both an operator name and a military-flavored alternate:
- Level 0: Visibility (Reconnaissance). Clean, unified data flowing automatically into one place.
- Level 1: Reporting Spine (Common Operating Picture). The same numbers, the same way, every month, across the portfolio.
- Level 2: Decision Guidance (Decision Support). AI surfaces patterns and anomalies on top of the spine.
- Level 3: Operating Cadence (Operational Tempo). The recurring operating rhythm runs on the system, not on email threads.
- Level 4: Compound Leverage (Force Multiplication). Selected workflows run autonomously, with humans handling exceptions only.
The operator names are the default for general use. The military names are reserved for veteran-led portfolio companies, where that register earns trust faster than it has to fight for it. This piece uses both throughout, because the framework is built on a navigation metaphor, and the military terms carry that metaphor cleanly: a common operating picture is exactly what a reporting spine produces, and operational tempo is exactly what an operating cadence sets.
A word on the floor. Most sub-institutional companies do not start at Level 0. They start below it, in the state the diagnostic calls Pre-L0: manual reporting, no real data foundation, and KPI definitions that drift from one portfolio company to the next. That is the honest starting point for the majority of the lower-middle market. The point of the ladder is not to flatter the climber. It is to name the next rung correctly.
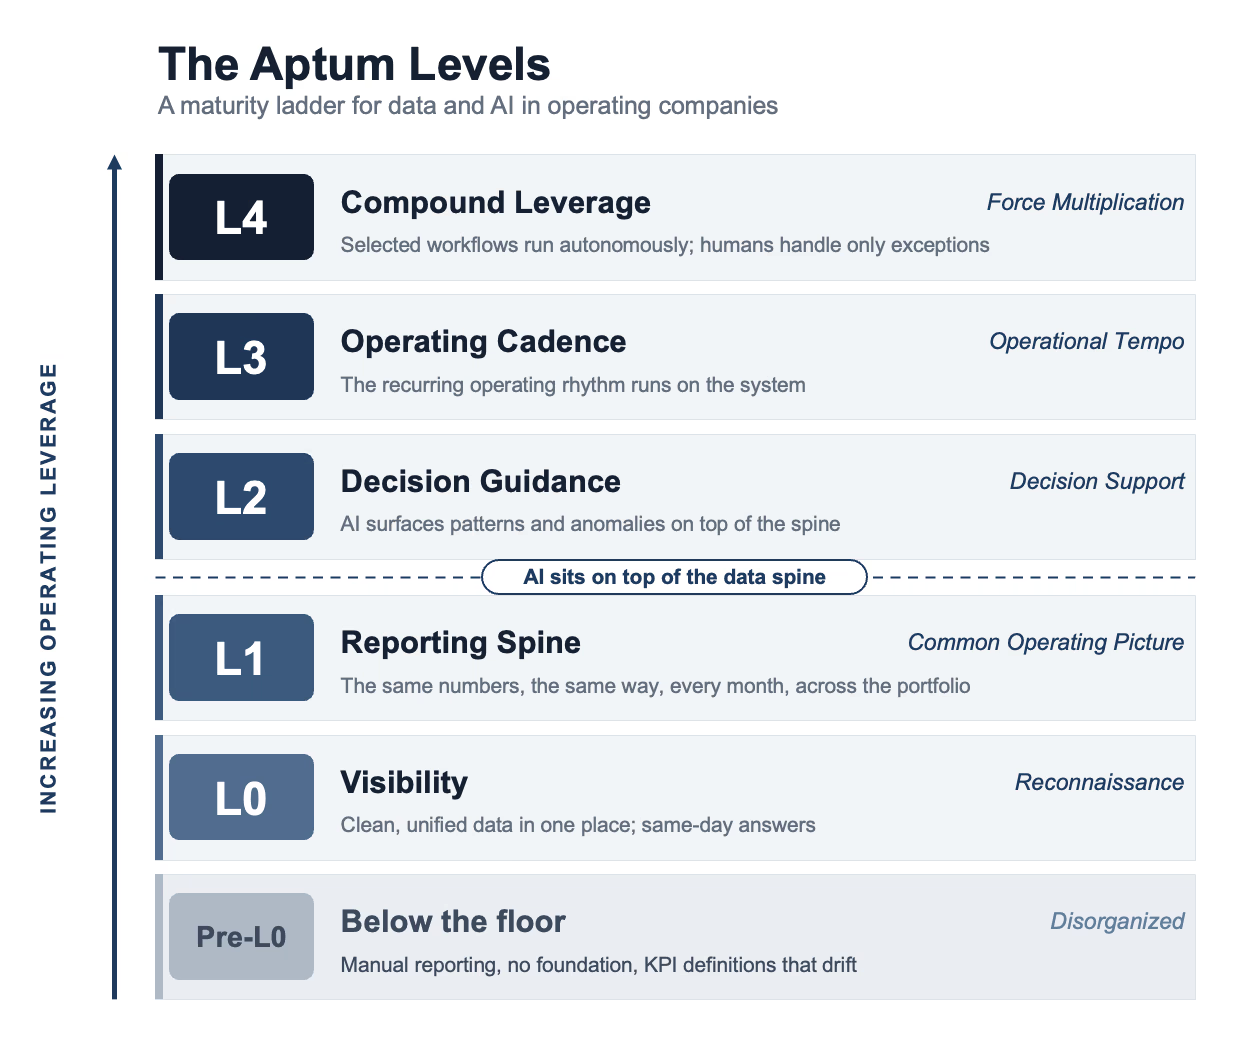
The Aptum Levels: a five-rung ladder from manual reporting to selective autonomy. Operator names left, military names right.
Level 0: Visibility (Reconnaissance)
What good looks like. Clean data flows automatically from the systems of record (accounting, CRM, project management, ticketing, operations platforms) into one place where it can be inspected without manual stitching. In practice this usually means a modern data lake or warehouse such as BigQuery or Snowflake with automated pipelines writing from source systems.
The test is simple: an operator can ask a question about the state of the business and get the answer the same day, not three days later.
Reconnaissance is necessary to understand where you’re at and what you’re up against. You cannot maneuver against terrain you have not yet seen.
What it is worth. Honest visibility. Most sub-institutional companies are not misleading their boards on purpose. They are doing their best, but assembling the data accurately takes longer than the reporting cycle allows. Level 0 ends the guessing on the most basic facts of the business. That alone changes the quality of every conversation that follows it.
Where operators get it wrong. The most common mistake is buying a reporting tool before the foundation can support it. A polished BI layer sitting on inconsistent source data produces inconsistent answers, only prettier. The second mistake is confusing a dashboard with a data foundation: if a human refreshes it by hand each cycle, it is not infrastructure. The third, and most common, is adding analysts to clean and aggregate data when the real problem is the absence of a data layer underneath. More hands on a broken process produce a faster broken process, and it doesn’t scale.
What it takes to climb. Once Level 0 is in place, the move to Level 1 requires a reporting spine: standardized KPI definitions across the portfolio, automated flows from the systems of record, and a layer where the same number can be looked up the same way by anyone with access.
Level 1: Reporting Spine (Common Operating Picture)
What good looks like. The same numbers, the same way, every month. Every portfolio company reports against shared KPI definitions. The numbers for board packs come effortlessly, and are consistent every quarter. An operating partner can pull up the portfolio dashboard at nine in the evening before a board meeting and find the data already correct, untouched since the last close.
In the military, we call this a common operating picture: one shared, authoritative view of the situation that every function reads the same way.
What it is worth. Comparison. Once every portfolio company is on the spine, they can be compared: by margin trajectory, by working-capital efficiency, by revenue per head, by whatever the operating thesis actually cares about. Comparison is what turns a portfolio from a list of companies into a portfolio. It is the rung where the deal team and the operating team finally argue from the same numbers.
Where operators get it wrong. The first error is treating Level 1 as the destination. The reporting spine tells you what is happening; it does not tell you what to do about it. Companies that stop here often spend a year polishing the dashboard and wondering why the value-creation plan has not moved. The second error is over-investing in presentation before the definitions are settled. A beautiful dashboard or board deck built on a contested metric only leads to more work, because the first thing anyone does with a number they distrust is rebuild it themselves.
What it takes to climb. Moving from Level 1 to Level 2 requires adding intelligence on top of the spine: anomaly detection, pattern surfacing, recommendation generation. Level 1 answers what is happening. Level 2 begins to answer what should we do about it.
Level 2: Decision Guidance (Decision Support)
What good looks like. On Monday morning an operating partner opens the system and sees more than the metrics. They see the company whose unit economics are diverging from plan, the working-capital pattern that historically precedes covenant pressure, and the sales department whose pipeline coverage is quietly sliding, putting that quarters quota at risk.
The system surfaced all three without being asked. The operator can interrogate the data in natural language and get answers drawn directly from the underlying numbers and their agreed definitions. This is decision support, not decision-making: the system surfaced the issues, the operator decides what to do with them.
What it is worth. Speed and consistency in decision-making. A value-creation plan is, in practice, a sequence of decisions. Level 2 makes those decisions faster, more consistent across the portfolio, and less dependent on which analyst happened to look at the data that week. Pattern recognition that used to live in one senior operator's head now runs against every company in the portfolio. A new operating partner becomes productive in months rather than quarters, because the system carries the institutional judgment, even as it iterates and evolves.
Where operators get it wrong. The first error is adding AI subscriptions without a real reporting spine underneath. Intelligence layered on inconsistent data, or without a proper semantic layer, can produce confident, well-formatted, wrong answers. The second is treating the output as decisions rather than as guidance. Level 2 informs the call; the business operator still owns it. The third is optimizing for whatever metric the system can flag most easily, rather than the ones that actually map to value creation.
What it takes to climb. The move to Level 3 embeds the intelligence into the operating rhythm itself: not just surfacing patterns when someone logs in, but participating in the recurring reports, handoffs, and reviews that constitute the operating cadence.
Level 3: Operating Cadence (Operational Tempo)
What good looks like. The Monday operating call opens with a pre-read the system generated overnight. The Friday close runs on a handoff the system orchestrated. The mid-quarter portfolio review starts from an exception list the system curated. The operating tempo is still set by the value-creation plan, but it runs on the system rather than on email threads and shared notes. Operational tempo is the rate at which an organization can observe, orient, decide, and act; at Level 3, the system sets and holds that rate.
What it is worth. Operating leverage. At Level 2, the intelligence augments individual decisions. At Level 3, it augments the recurring cadence of the whole operating organization. The team gets faster without getting bigger. The institutional knowledge that previously lived in the heads of the two senior operators who never take vacation gets absorbed into workflows the rest of the team can run. A new operating partner can pick up the cadence in weeks, because the cadence is carried by the system, not by tribal memory.
Where operators get it wrong. The first error is confusing automation with cadence. Automating a bad operating rhythm only makes the bad rhythm faster. The second is building Level 3 capability before Levels 1 and 2 are stable; an operating cadence running on contested data is an expensive way to accelerate confusion. The third is treating this as a software-adoption project. Level 3 is an operating-model change that tooling carries, not a tooling change that the operating model tolerates. The companies that get this rung wrong almost always tried to skip the two beneath it.
What it takes to climb. The move to Level 4 is selective autonomy: identifying the few recurring decisions that are well suited to running without a human in the loop, under defined constraints, with exceptions routed back to a person.
It’s worth flagging that very few companies make it to Level 3 or 4. For most, getting to Level 2 is an 18-24-month journey that already gives them a huge advantage over the competition.
Level 4: Compound Leverage (Force Multiplication)
What good looks like. In the narrow set of workflows where it makes sense (collections orchestration, vendor-spend monitoring, lead routing, supply-chain anomaly response, exception-only operations work), the system runs on its own. Humans see the exceptions; the system handles the rest. This is force multiplication: the same operators produce more output without more of them.
What it is worth. Asymmetric scaling. Most operating organizations grow capability by hiring more operators. Level 4 makes capability growth partially independent of headcount growth, which is where margin structurally improves over multi-year horizons. It is the difference between a portfolio that gets more expensive as it gets more capable and one that does not.
Where operators get it wrong. The first error is trying to take the entire operating model to Level 4 rather than selecting the few workflows where the leverage is real and the risk is bounded. The second is confusing Level 4 with AI agents. Level 4 is an outcome state, not a tooling label; the agents are a means. The third, and the most damaging, is attempting autonomy without the Level 1 through Level 3 substrate beneath it. Autonomy on top of contested data and an undefined cadence is the pattern that produces the operating disasters that later get written up as cautionary case studies.
An honest note on this rung. Most sub-institutional portfolio companies do not need Level 4 to hit their value-creation plans. It is a long-horizon, deliberate-commitment state appropriate for portfolios with multi-year holds, for holdcos with an explicit operating-leverage thesis, and for specific narrow workflows where the math is clear. It is an option that becomes available once Level 3 is real. It is not the goal of every engagement, and often the ROI is only justified in specific and narrow use-cases.
How to find your actual rung
The Levels are built to be self-diagnosed, without a consultant and without the ability to flatter your way up a rung. Read each question, answer honestly, and take the highest rung you can answer yes to as your current Level.
- L1 Reporting Spine (Common Operating Picture). Are KPI definitions documented, shared across the portfolio, and consistent enough that the CFO and the COO bring the same numbers to the same meeting? Can numbers be refreshed in minutes, or does it take hours or days?
- L2 Decision Guidance (Decision Support). Does the system surface patterns and anomalies nobody specifically asked about, with flags that are usefully accurate? Can you quickly gather numbers or insights that aren't part of your standard operating KPI's? Can you easily answer questions about the business with supporting data?
- L3 Operating Cadence (Operational Tempo). Do the recurring rhythms (weekly, monthly, quarterly reviews) run on the system rather than on email and chase messages?
- L4 Compound Leverage (Force Multiplication). Are there bounded workflows that run with no human in the loop, where the operator sees only exceptions? Is capability is increasing without headcount increasing?
If the answer to the first question is no, the company is below Level 0, and the work is to get to Level 0. It is not to start at Level 4. The most expensive mistakes in this space come from companies plotting a course to a distant rung from a starting position they never fixed honestly.
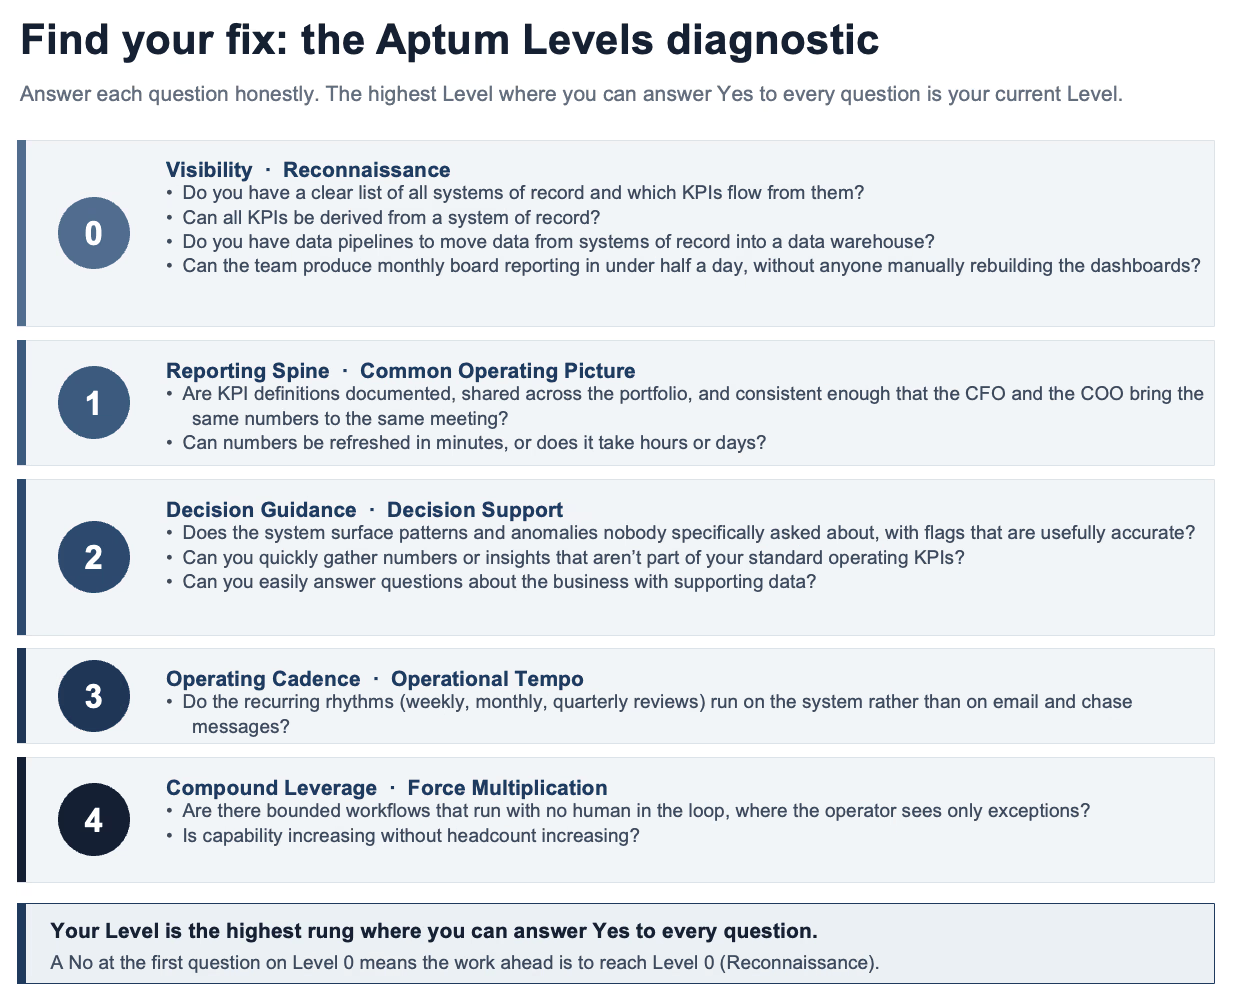
The five-question diagnostic. Your Level is the highest rung you can answer yes to.
What the framework is for
The Levels are the value proposition: what good looks like, what state a company is in, and what state it could reasonably reach next. The work that delivers a transition is a separate question, and it is deliberately ordered second. An honest diagnosis comes before any recommendation about what to build.
That ordering matters because it inverts the usual consulting move. Most firms sell the mechanism first and reverse-engineer the rationale. A framework that diagnoses position first makes the next move obvious on its own terms: a company at Level 0 with one stranded Level 1 capability does not need a pitch to understand that the work ahead is a reporting spine. The diagnosis does the explaining.
The one-page version
The Aptum Levels are a five-rung maturity ladder for data and AI inside an operating company: Visibility, Reporting Spine, Decision Guidance, Operating Cadence, and Compound Leverage. Most companies start below the first rung and believe they are above it. The framework's first and most valuable job is to correct that error, because every move plotted from a wrong position inherits the error and compounds it.
Fix the position first. The route gets simple after that.
Not sure which rung your company actually sits on? Find your Aptum AI Level in five minutes. You will get an honest starting point and the next practical move, without booking a call.