Understanding the Difference Between Realtime and Snapshot Data
Many business leaders describe a desire for "real time" visibility into their business: what's the current state right now? How many active customers do we have? What's our revenue and what are our costs? What's the state of our sales pipeline?
Real-time visibility in a business can help leaders make better, more timely decisions. Rather than waiting for the accounting team to close the books and provide revenue and costs, or for the FP&A team to create a series of reports, many businesses are turning to live dashboards. With modern data tooling, dashboards can provide live data from multiple sources in one place: total pipeline value, current contract value, and number of customers.
But what if the CEO wants to understand how those values compare to the same time last quarter? Or last year? What if the CEO wants to understand how much of this quarter's weighted pipeline is likely to convert into actual sales?
Those questions require not just realtime data, but historical snapshots of past data. If the company didn't intentionally take those data snapshots, they likely have no way of answering those types of questions.
Realtime data shows what is happening right now, while historical snapshot data can help explain why it matters.
Moving from just realtime data to intentionally storing historical snapshots of past data is a sign of a company's data maturity.
What is Realtime Data?
Realtime Data Defined
Realtime data is data that reflects the current state of the business. This data typically lives in operational software systems such as a CRM, ERP, project management system, ticketing system, or time tracking system.
Most software applications provide some level of dashboarding functionality. Companies with a bit more sophistication might aggregate data from multiple systems into a single leader's dashboard to provide visibility into company KPI performance.
Where Realtime Data Excels
Realtime data excels at answering questions about the current state of the business. Examples of questions that it can help answer include:
- Active customers right now
- Current pipeline value
- Total hours logged against a live project
- Open support tickets
Having this data is important and essential for business monitoring and execution. But, this data doesn't provide sufficient information for business planning and strategy.
The Hidden Limitation of Realtime-Only Analytics
The "Always Now" Problem
The problem with realtime data is that it has no memory. Dashboards are updated in realtime, but there's no way to "rewind the clock" to see what the dashboard said at the same time last month, last quarter, or last year.
Because of that limitation, it is difficult - perhaps impossible - for a business to understand if the numbers it sees on a live dashboard are good or bad. Is the business improving, stagnating, or declining?
Why Many Companies Get Stuck Here
Most companies get stuck here for two main reasons.
First, they think accounting numbers are sufficient to help them understand trends over time. By looking back at historical accounting numbers, it is possible to see how this month's revenue compares to the same time last year. It is possible to run some historical reports based on accounting data.
Second, most companies think that the software tools they use store historical data which can be analyzed if needed. However, this is rarely the case. Most software tools only store live data, with no way to see a full picture of current-state in the past. Software tools that do store some historical information usually only store partial historical information about some aspects of data. For example, what date a deal in a CRM was closed and won.
Taking more comprehensive historical snapshots of data, however, requires intentional design. It requires more advanced tooling, such as a data lake and ETL pipelines. Most companies don't have those resources in-house, and doing the work feels extra and superfluous.
What is Snapshot (Historical) Data?
Snapshot Data Defined
Snapshot data is point-in-time captures of key metrics that has a date stamp, or a datetime stamp, depending on snapshot frequency. The most common frequency for snapshot data is daily, though some companies may choose weekly snapshots when starting out. Highly advanced companies may even take hourly snapshots for certain data.
The key for snapshot data is that it preserves state as it exists at a specific point in time.
In general, snapshot data will follow the same exact structure of the realtime data, but add a date stamp.
Why Snapshots are a Sign of Data Maturity
Snapshot data is a sign of data maturity for several reasons.
First, it requires an understanding of the limitations of realtime data, and the knowledge of how to move from realtime to snapshot data.
Second, it requires a deliberate, intentional data infrastructure beyond simple SaaS tools: at a minimum it requires a database, or a data lake for more complex data, and an ETL pipeline.
Meeting those requirements involves a jump in data maturity, from:
- What's happening?
- What changed?
To:
- Is the change meaningful?
- What should we do about it?
- What is likely to happen next?
Critically, data snapshots are the first step towards building prediction models about key performance indicators.
Realtime vs. Snapshot Data - A Simple Mental Model
Realtime data can tell you where you are. Snapshot data tells you where you've been, helps you understand the significance of where you are, and can be used to forecast where you're going.
| Purpose | Realtime Data | Snapshot Data |
|---|---|---|
| Daily Execution | ✅ | ❌ |
| Business Monitoring | ✅ | ✅ |
| Trend Analysis | ❌ | ✅ |
| ML Predictions | ❌ | ✅ |
| Strategic Decisions | ❌ | ✅ |
Business Examples That Break Without Snapshot Data
Sales Pipeline & Revenue Predictability
Nearly every business doing at least $1M+ in annual revenue has a CRM to track their sales pipeline. Many do regular, weekly reviews of their sales pipeline and analyze metrics such as:
- Number of deals in the pipeline
- Total pipeline value
- Weighted pipeline value
- Average deal size
- Manager expected value
However, when businesses look at their sales pipeline through a purely real-time lens, they lack the ability to understand it in context or to make accurate predictions and forecasts. Snapshot data fixes this by allowing all of the above values to be compared to the same time last month, last quarter, or last year. Once you have robust historical snapshots of your sales pipeline, you can also measure:
- Historical conversion rates:
- What percentage of our pipeline (or weighted pipeline) did we close by quarter's end? By year's end?
- Pipeline/quota ratio:
- What was our pipeline/quota ratio at this time last year? How did that compare to our final closed/quota ratio?
- Multi-year averages:
- What is our 3-year average for pipeline/quota ratio? pipeline/final closed?
After 2+ years of gathering these historical snapshots, companies can begin to build machine learning prediction models that predict pipeline-to-sales conversion.
Perhaps more importantly, companies can start to set pipeline benchmarks based on their revenue goals: In Q1 we historically closed 50% of our weighted pipeline as of January 30th, so if we want to close $1M in Q1, we need to have a healthy weighted pipeline of $2M by January 30th.
That sort of strategic insight is only possible after years of taking historical snapshots of your sales pipeline.
Expected vs. Actual Hourly Rate (Service Businesses)
For the 78% of businesses in the United States that are services businesses, understanding your actual hourly rate on a project, and how that trends over time, is one of the most important things you can measure in your business.
Here's an example of how that can work in practice. Say you have a project for a flat $10,000 that you expect to complete in 100 hours - ie, for $100/hour - over the course of 30 days. On day 1, maybe you, or one of your employees, spends a full 8 hours on that project. At that rate, you'd spend 240 hours on that project and end up with an hourly rate of $41.66, less than half of your expected hourly rate.
But let's say your employee then spent 1 hour per day for the next 4 days. Are you on track to meet or exceed your expected hourly rate? By taking daily snapshots of your project data, including budgeted hours, actual hours, total planned days, and days elapsed, you can easily plot the trendline for your effective hourly rate on the project.
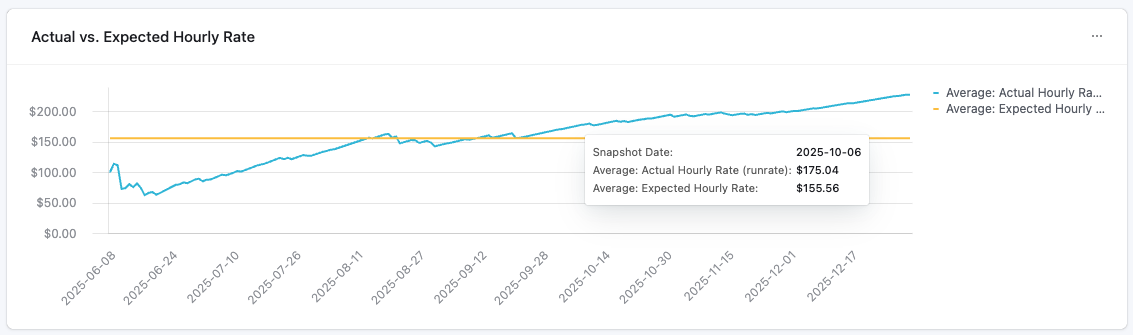
In my experience, nearly every service business that tracks this data will follow a trendline similar to the one above. There's a heavy initial investment of time in a new project, but over time, the project enters a "steady state" where the effective hourly rate tends to increase.
By leveraging snapshot data and understanding this trend, businesses can make better decisions about their project resourcing and associated costs, increasing both gross margins and overall revenue potential.
How Snapshot Data Creates Business Leverage
Better Decisions, Faster Than Competitors
"I need this data by the end of the week!"
Whether you work for a large or small company, you've probably heard that at some point. The CEO or another senior leader is trying to understand some aspect of the business to inform an important decision.
Predictability = Power
The real power of snapshot data is not just that it helps explain the past. It helps reduce uncertainty about the future.
- Every business leader is, in some sense, making bets about what is likely to happen next:
- Will we hit this quarter's revenue target?
- Will this project stay profitable?
- Will support ticket volume overwhelm the team next month?
- Will our current staffing plan be enough?
Without historical snapshots, those bets are largely driven by instinct, anecdote, or fragmented reporting. With snapshots, they can be grounded in pattern recognition. Leaders can see not just what is true now, but how similar situations have played out before.
That shift matters. Predictability creates confidence. Confidence improves decision-making. Better decision-making compounds over time.
A company that can consistently forecast outcomes more accurately than its competitors has a real strategic advantage. It can hire sooner or more carefully. It can invest more aggressively or more selectively. It can identify risk earlier. It can operate with more precision and less waste.
In that sense, predictability is not just a reporting benefit. It is a form of power.
Data Maturity
Data maturity is often misunderstood. Many people assume it means having a modern dashboarding tool, a data warehouse, or a team of analysts. Those things can help, but they are not the essence of maturity.
Data maturity is the degree to which a company can use data to understand its business, make decisions, and improve outcomes over time.
An immature company tends to operate from disconnected systems, ad hoc reports, and intuition. When an important question comes up, the team scrambles to assemble the answer manually. Data exists, but it is fragmented, inconsistent, and mostly reactive.
A more mature company has moved beyond that. It has defined key business metrics, established systems to capture them consistently, and built the infrastructure required to preserve and analyze those metrics over time. It does not just ask what happened. It asks what is changing, whether it matters, and what is likely to happen next.
That is why the move from realtime-only data to historical snapshot data is so important. It marks the point where a company begins to develop memory, context, and eventually foresight.
Data Maturity as Competitive Advantage
Most competitive advantages are hard to see at first. They do not always look dramatic in the moment. Often, they look like slightly better decisions made repeatedly over a long period of time.
Data maturity works this way.
A mature company usually does not win because it has prettier dashboards. It wins because it understands its business more clearly than competitors do. It can detect changes sooner. It can interpret signals with more accuracy. It can forecast with more confidence. It can allocate resources more effectively.
Over time, that creates compounding benefits:
- More accurate forecasts
- Better pricing decisions
- Stronger project selection
- Healthier margins
- Earlier identification of risk
- More disciplined growth
Meanwhile, less mature competitors continue operating in a reactive mode. They discover problems later. They misread trends. They confuse motion for progress. They overestimate what is working and underestimate what is breaking.
This is why data maturity should not be thought of as a back-office technical concern. It is an operational and strategic advantage. In many industries, especially those with tight margins or long sales cycles, it can become one of the clearest separators between firms that scale well and firms that remain stuck.
How Mature Companies Use Both Together
Mature companies don't choose between realtime and snapshot data. They use both, because each serves a different purpose.
Realtime data supports execution. It helps teams monitor the present and respond quickly.
Leaders use it to answer questions like:
- What is happening right now?
- What requires action today?
- Where do we need immediate visibility?
Snapshot data supports analysis, planning, and prediction. It helps leaders step back and evaluate performance in context. They use it to answer questions like:
- Is this trend normal or unusual?
- Are we ahead or behind where we were at this point last quarter?
- What is likely to happen if current patterns continue?
The best operating model is not realtime or historical. It is realtime for action, and snapshots for judgment.
For example, a sales leader might use live CRM data to review today's pipeline, but use historical snapshots to understand whether current pipeline coverage is actually healthy for this stage of the quarter. A services leader might use live project data to monitor hours logged today, but use snapshots to determine whether a project is trending toward profitability or erosion.
Used together, these two forms of data create a much fuller picture of the business. One provides visibility. The other provides meaning.
Where Most Companies Go Wrong (And How to Fix It)
Most companies do not fail because they lack data. They fail because they assume the data they already have is enough.
One common mistake is over-relying on live dashboards. A dashboard may be visually impressive and operationally useful, but if it only shows the current state, it cannot answer many of the most important strategic questions.
Another mistake is assuming source systems will preserve history automatically. In most cases, they will not. Or they will preserve only narrow pieces of history that are insufficient for serious analysis.
A third mistake is waiting too long to start. Many companies assume they need a full modern data stack before they can begin taking snapshots. That is not true. While advanced infrastructure helps, the more important step is simply to begin capturing the right business states at regular intervals. A lightweight approach started today is often far better than a perfect architecture delayed for another year.
The fix is straightforward, even if it requires deliberate effort:
- First, identify the handful of business processes where historical context matters most. For most companies, this is sales, revenue, project delivery, support, or operations.
- Second, define the key metrics or objects whose state should be preserved over time.
- Third, begin taking regular snapshots and storing them in a structured way.
- Fourth, use those snapshots not just for reporting, but for review, benchmarking, and decision-making.
The goal is not to create more data for its own sake. The goal is to make the business more understandable, more predictable, and ultimately more controllable.
Final Thought: Data Maturity is a Choice
No company becomes data mature by accident.
It happens when leaders decide that understanding the business more deeply is worth the effort. It happens when they move beyond the convenience of live dashboards and invest in preserving the history required for real analysis. It happens when they treat data not just as a reporting output, but as an operational asset.
The companies that do this gain something valuable: context, predictability, and leverage. They do not just know what is happening. They understand what it means, what is likely to happen next, and what they should do about it.
That is the real difference.
Data maturity is not just a technical capability. It is a management choice. And increasingly, it is a competitive one.